


Engagements
When it comes to finding a one-of-a-kind engagement ring, 45% of proposers begin researching/looking for rings more than five months ahead of the proposal, with 71% making the final purchase less than two months prior. Forty percent purchase the ring from a local retailer, 30% at a national chain, and 10% from an online retailer. While features such as stone type, size and brand all greatly impact cost, roughly half of couples will spend under $5,000 on the engagement ring (though 20% spend more than $10K).
Engagement Ring
Couples consider style/setting to be the most important aspect of an engagement ring. In fact, nearly 80% admit to dropping hints about their ring preferences and 7 out of 10 have some involvement in selecting and/or purchasing the ring itself.
Did you know? On average, proposers visit three retailers in person and look at 15 rings before making a decision.
Most Popular Ring Features
- Diamond ............. 87%
- Side stones ......... 71%
- White gold ......... 54%
- Round cut ........... 47%
- Prong setting ..... 36%
- 50% One to two carats (total)
Proposal Season
Seven out of the ten most popular days to propose take place in December, with the average engagement lasting 15 months.
Top Engagement Dates
By Month
By Date
- Christmas Day 12/25
- Christmas Eve 12/24
- New Year’s Day 1/1
- Sunday before Christmas Eve 12/22*
- Valentine’s Day 2/14
The Proposal
From picking the location to hiring a photographer and even planning a post-engagement get-together with family and friends, over 40% of proposers start putting plans in place one to three months in advance of the proposal.

Planning Ahead
-
87%
planned ahead of time
-
65%
asked parents’ permission
-
35%
discussed proposal preferences with partner
-
34%
timed it based on a planned trip
In the Moment
-
89%
proposed with ring in hand
-
84%
asked on bended knee
-
51%
took place in private
-
30%
took place in a scenic location
Though factors such as length of engagement, location and venue type impact a couples’ decision on when to get married, fall continues to be peak wedding season nationwide. Nearly 50% of fall ceremonies take place outdoors. As we look ahead to 2020, data already indicates that October will be the most popular month to get married for the fourth consecutive year.
Top 5 Wedding Dates in 2020 2019 2018 2017
-
1
October 10
-
2
June 20
-
3
September 19
-
4
October 17
-
5
September 12
-
1
October 19
-
2
September 14
-
3
May 4
-
4
October 12
-
5
October 5
-
1
October 20
-
2
October 6
-
3
September 22
-
4
May 19
-
5
October 13
-
1
October 7
-
2
October 14
-
3
September 30
-
4
October 21
-
5
November 11
2020 2019 2018 2017 Wedding Month Distribution
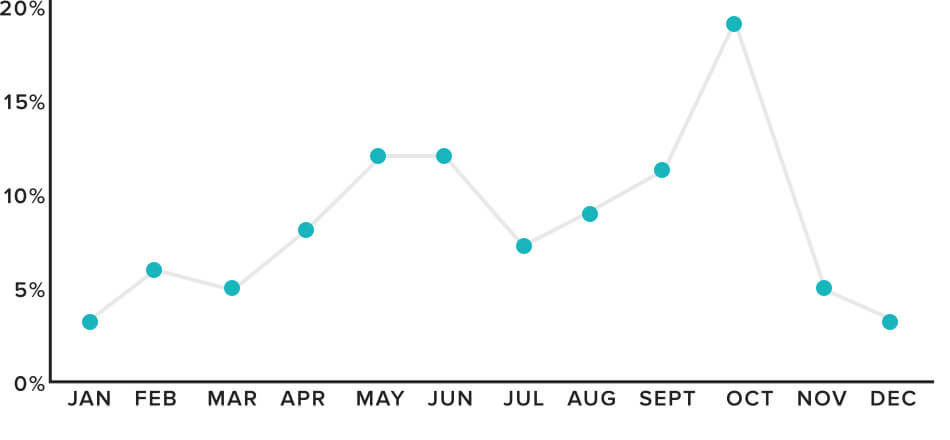
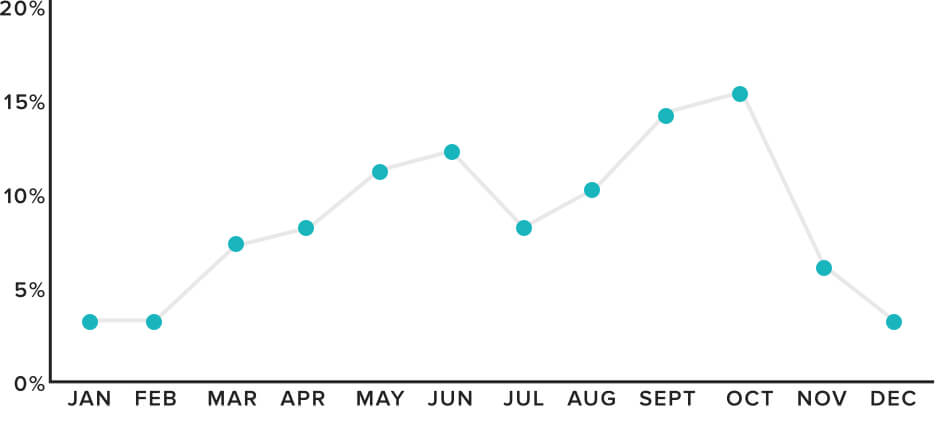
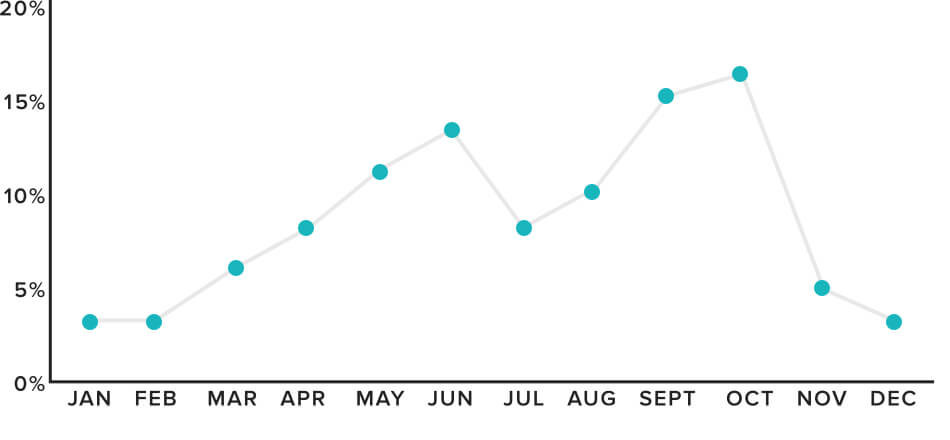
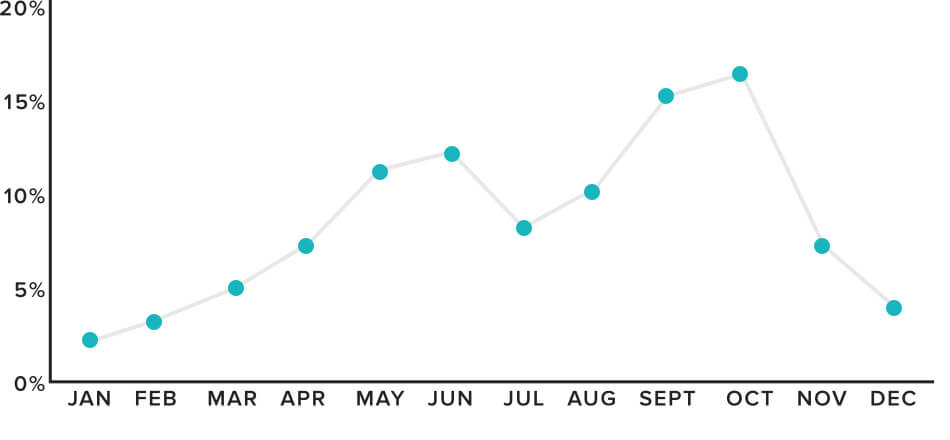
2020 dates based on couples engaged in 2019 who set a wedding date in 2020
Planning
While the average couple is engaged for 15 months, over 85% of couples start discussing their wedding preferences—like guest count (63%) and type of venue (57%)—prior to getting engaged. Despite being so proactive, couples still say one of their biggest challenges during planning is “knowing where to start” in addition to “planning within budget.” Fortunately today’s tech-savvy couples are able to take advantage of online and mobile planning tools to guide them through the planning process.
Getting a Jumpstart on Planning
Today, the majority of couples are not only thinking about their wedding prior to getting engaged, but two out of three are taking action and actually starting the planning process. From gathering inspiration to researching vendors and estimating cost, couples are laying the foundation so they can hit the ground running when the time comes.
 “We started planning our wedding before he actually got down on one knee with a ring. We didn’t put deposits on anything, but we talked about budget, guest list, venues we both liked, etc.” — CJ, 2019 Newlywed
Top 8 Pre-Engaged Planning Actions
-
1
Create inspiration/Pinterest board
-
2
Look at wedding attire online
-
3
Research wedding costs
-
4
Research wedding venues
-
5
Start creating a guest list
-
6
Check availability/cost of venues
-
7
Read reviews of potential wedding vendors
-
8
Start following vendors on social media
Who’s Involved in Planning
When it comes to planning the wedding, we see the bride* takes on the bulk of the planning responsibilities. However, it’s not to say many don’t get help from their partner, parents and even a planner. In fact, nearly one in three couples hire a wedding planner—the most popular type being a day-of-coordinator followed by a full-service planner.

Did you know?
81% of parents are involved in the decision making for their child’s wedding, with one in four being put in charge of handling specific tasks, items or vendors.% of Planning
-
67%
Bride

-
14%
Groom
-
13%
Parents
- 6% Other
- = 100% Planned

*based on females in a heterosexual relationship
Planning Resources
Today, nearly 90% of planning is done online which should come as no surprise given the amount of online resources available. When looking at planning behaviors, over 75% of couples use social media (mainly for inspiration), while 64% use wedding planning apps to get things done—most notably to access their planning checklist.
Top 5 Tasks Done on Mobile Devices
-
75%
Look up vendor information
-
71%
Access wedding planning sites
-
70%
Research wedding vendors
-
70%
Browse photo galleries
-
65%
Read vendor reviews

Use of Tech During Planning
Couples are quick to take advantage of the newest technology to help streamline the planning process (think: video calls, online 360 virtual tours, etc.). As we see more and more couples opting out of local or hometown weddings (roughly one in four), it’s no surprise couples are turning to tech to bridge the gap of that missing 1:1 vendor interaction.
-
Create a wedding website
79% -
Use a mobile planning app
64% -
Set up a wedding hashtag
53% -
Watch online videos for inspiration
31% -
Use online chats to speak with a vendor(s)
30% -
Video chat with a vendor
17%
Selecting a Vendor Team
On average, couples hire 15 vendors for their wedding day. While price continues to be the key factor in deciding who to contact, couples emphasize the importance reviews and photos have on their decision making. When it comes to reviews, couples tell us they most value the overall review rating, photos submitted by real couples and the recency of a review (70%).
Top Vendors Hired
- 92% Venue
- 89% Photographer
- 87% Caterer
- 82% Cake
- 76% Beauty
- 71% DJ
- 71% Event Rentals
- 70% Florist
Couples
From engagement length to guest count and even how they meet, today’s couples are changing it up. In fact, just 12 years ago, the average couple got married at age 27 (now, the average is 32) and only 12% of couples met online. Today, that number is nearly double and online dating is the most popular way newlyweds-to-be meet! As today’s couples are prioritizing other aspects of their life before marriage, it’s no surprise we’re seeing shifts in their behaviors, sentiment and how they’re communicating with their partner before getting married.
Who Are Today’s Newly-Engaged Couples?
 1 in 4
met online
own a home together
have spoken about future finances
discussed if one person would change their last name after getting engaged
 27%
27%
grew up in different regions or countries
date 2+ years before getting engaged
have traveled outside the US together

have a pet together

Today’s Couples by the Numbers
Though every wedding is unique across the nation, data shows us that there are similarities that emerge among couples of similar backgrounds—whether that means couples of equivalent race, sexual orientation, cultural roots and/or demographics. Click on the tabs below to see how data changes among the following groups.
-
32
21
30
46
37
32
32
32
36
Average age of couples
-
131
148
135
99
129
173
133
134
115
Average number of guests
-
10
10
10
8
12
12
10
10
8
Number of wedding party members
-
15 months
11 months
15 months
16 months
16 months
15 months
15 months
16 months
20 months
Average engagement length
-
77%
37%
80%
79%
71%
56%
79%
65%
93%
Lived together pre-wedding
-
72%
79%
77%
44%
61%
50%
77%
56%
47%
Had a wedding shower
-
65%
73%
69%
35%
49%
64%
68%
57%
40%
Asked for parents’ blessing
-
25%
42%
26%
14%
24%
22%
26%
20%
20%
Had a hometown wedding
-
77%
90%
78%
70%
71%
44%
80%
67%
49%
Changed last name
-

Calculations based on partners with equal identifiers (i.e., same reported race).
Gen Z: 1997-current, Millennials: 1982-1996, Gen X: 1961-1981
Wedding Trends
As weddings evolve over time, so do the trends associated with them such as unplugged ceremonies, non-matching bridesmaids’ dresses (up 20% since 2014) and the use of wedding planning apps (up 22% since 2014). New, popular traditions are taking hold every day. For example, over one quarter of couples are now taking “mini-moons” in lieu of or prior to a full honeymoon (28%). Check out the stats below to see how couples make their wedding uniquely their own.
Preparation

Break out the to-do lists! While every couple’s focus is different, there are many common steps couples take after saying “yes,” especially when it comes to booking vendors. Scroll down to see how vendors help make a couple’s wedding smooth and memorable.
-
Pick your color scheme: 79% of couples incorporate their wedding colors into their floral arrangements
-
Book a venue: 21% of couples hold their reception at a banquet hall, followed by barn/farm (18%) and historical building (12%)
-
Hire a wedding planner: 30% hire a planner for some or all of the wedding logistics
-
Create a wedding website: 79% create a wedding website to share details with their guests
-
Say “yes” to the attire: 54% of brides try on up to six dresses before finding the one. 66% of grooms dress in a suit or more casual than a tuxedo
-
Select your photographer: 60% of couples find the style of photography to be most important when deciding who to hire
-
Decide on entertainment: Over 50% of couples say they’ve seen their band or DJ perform in person prior to booking them
-
Purchase your wedding bands: Over 50% of female wedding bands are made of white gold, while Tungsten is the most popular metal for men (23%)
-
Hire an officiant: 55% of hired officiants fully customized the ceremony for the couple
Party Time!

From traditional aspects such as wearing white to the more uncommon like having bagpipes at the reception (anyone up for a Highland Dance?), couples are incorporating all types of classic and unique elements into their big day.
Ceremony
-
60%
had a ring bearer and/or flower girl
-
52%
honored family that couldn’t attend
-
46%
saw partner prior to the ceremony ("first look")
-
41%
had unique musical choices
-
38%
wrote personal letters to each other that were read on the wedding day
-
36%
asked for guests to "unplug" during ceremony
Reception
-
91%
couple performed first dance
# 1 wedding tradition -
83%
had a cake-cutting ceremony
# 1 food/drink tradition -
78%
had an open-bar, less than 10% having a dry wedding
-
50%
had grand entrance or exit
-
35%
displayed unique wedding hashtag for guests to post
-
22%
incorporated elements based on the city where the couple met or grew up

Honeymoonin’

Although the party might be over, the celebration doesn’t have to stop! More than 70% of couples jetset on a honeymoon to popular locations within the US (39%), Caribbean (26%) or Europe (13%) after their wedding. While the average couple spends roughly $5,000, 1 in 10 will spend over $10,000 with the majority pulling from their personal savings to pay for the trip (60%).
-
62%
left for their honeymoon within two days of their wedding reception
-
61%
of US-based couples honeymooned outside the continental US
-
52%
of couples selected a beach destination for their honeymoon
-
42%
of honeymoons lasted for more than a week (average eight days)
-
36%
started to plan their honeymoon four to six months before the wedding
-
28%
took a mini-moon (in lieu of or prior to a full honeymoon)
Cost
Aside from common expenses such as venue, catering and photography, the endless options for upgrades and special add-ons can cause wedding costs to add up. In fact, nearly 60% of couples increase their initial budget, primarily due to finding things along the way that they felt they “needed to have” and realizing they may have underestimated at first pass. At the end of the day, couples on average spend roughly $28,000 on their ceremony/reception, which equals about $215 per guest.
Budgeting for the Wedding
Couples tell us that guest count, location and venue are the top three aspects they consider when determining their wedding budget. Since the venue is often the first decision a couple will make, knowing this cost early on allows them to figure out how to divvy up the remaining budget to meet their needs.

Resources Used to Determine Budget
-
1
Online search
-
2
Advice from family/friends
-
3
Pricing shown on wedding planning websites
- 4
-
5
Social media
Getting Real About Budget
Expectation
Couples budget around
$23,000Reality
... but end up spending nearly
$30,000Over 80% of couples set a rough budget before researching any vendors—often underestimating the cost of products and services. In fact, roughly forty percent of increased budgets are due to couples admitting they set a lower initial budget than what was realistic.
Reasons Couples Spend More
Fifty-four percent of couples increase their budget during planning, with 45% allocating additional funds to wedding items they fell in love with along the way. While it may not have been in the initial budget, 62% of newlyweds say they don’t regret the splurge and would spend the extra money again.
Top 5 Reasons Budget Increases
-
45%
Found “must-have” items during planning
-
42%
Initial budget was set lower than reality
-
34%
Added custom/personalized elements
-
32%
Guest count changed
-
29%
Opted for upgrades (ex. exotic flowers, linens, etc.)
Most Popular Places Couples Increase Budget
-
47%
Photography
-
41%
Food
-
34%
Attire
-
30%
Wedding Bands
-
26%
Venue
“I think photography is the one area you should most definitely splurge. Pictures are something you are going to look back on for the rest of your life. We ended up paying [more than average] for a package ... and it was worth every penny!” — Alexandra, 2020 Newlywed

Who’s Paying for the Wedding
The average couple pays for roughly half of the wedding cost, mostly pulling from savings (45%). However it’s the parents who are often footing the majority of the bill (52%). While nearly 60% of parents agree to pay for certain items, such as dress or venue, roughly one-third write a check for the couple to spend at their discretion.
Percent of Wedding Paid For
How Couples Pay
-
45%
Savings
-
38%
Cash
-
37%
Checking Account
-
32%
Credit Cards
Ceremony/Reception Spend
When looking at overall cost of a wedding, there are many factors such as guest size, location and day-of details that impact the total cost. While the average Millennial wedding costs nearly $10,000 more than a Gen X wedding, we know they are also more likely to invite 36 more guests, include an open bar (+6%) and serve late night snacks (+14%).
Destination weddings
Hometown weddings
1st marriage
2nd marriage
Millennials
Gen X
Same-sex couples
Opposite-sex couples
2019 Average Wedding Cost by Category
Methodology
The 2020 WeddingWire Newlywed Report is based on a survey among 27,250 individuals—the largest survey of weddings in the industry. The data is collected from couples who provided their email to The Knot Worldwide and were married between January 1 and December 31, 2019. Respondents represent couples from all over the country with various ethnicities, income levels, race, age, sexual orientation and gender identity. To provide the most comprehensive view of research collected, this report also includes findings from ad hoc studies conducted in 2019. In a typical year, The Knot Worldwide conducts research with more than 300,000 US brides, grooms, guests and wedding professionals.

Senior Director of Insights

Associate Director of Insights