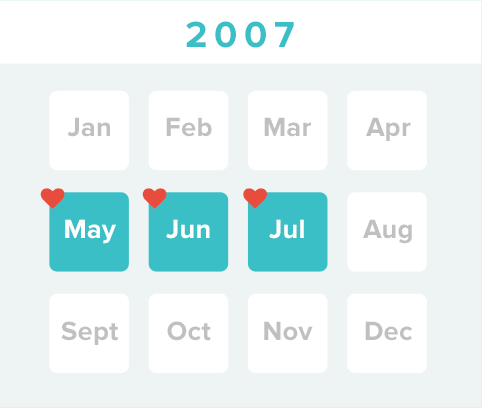
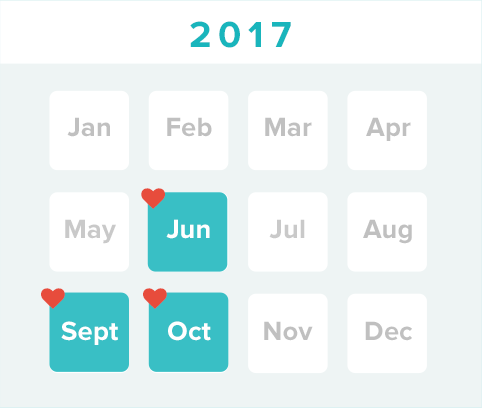
The not so basic basics — there has been a big shift in the last ten years when it comes to the marrying age, average spending on weddings, and popular wedding months to get married!
Don't worry if your S.O. hasn't popped the question just yet! Couples today are marrying older AND having longer engagements.
Average age of marrying female
Average age of marrying male
Engagement length
10 years and over $10k later... Although the guest list size hasn't changed much, couples are spending more on their weddings (and more per guest!).
Average spend on ceremony/reception

81% increase in spending!
Spend per guest
Number of guests
So with couples spending MORE on their wedding... who foots the bill?
From engagement ring prices to sharing your #justsaidyes moment and wedding day details, let's see how popping the question has changed in the last decade.
Engagement Ring Spend

Almost doubled!
Shout it from the rooftops! With social media sites like Instagram launching in 2010, couples are using social media to share their #justsaidyes moment and wedding details.
How announced: Social net-
working site
Announced engagement via social media or a video
Say cheese!

Took engagement photos with their partner
Wedding Websites help wedding guests learn more about wedding + registry details.

Created a wedding website

That's almost a 400% increase!
The last 10 years have certainly impacted pre-wedding and day-of details.
With so many new options, couples turn to wedding planners to help with logistics and alternative registries to get the items they really need.
Hired a wedding planner to help with all or some of their wedding logistics.
Used an alternative registry (i.e., honeymoon fund, house down payment, etc.)
The Bachelor/Bachelorette Party has evolved from one night to a weekend excursion.

Traveled out-of-state for either bachelor/bachelorette party destination
Trends on trends - day-of details have evolved over the last 10 years. Did any of these apply to your wedding?


Incorporated a theme into decor (i.e., beach, rustic, etc.)


Had a signature cocktail


Provided guests with an alternative dessert rather than a cake

That's nearly 1 in 4 couples!


Ceremony was held in a place of worship
Is there pressure behind planning? Learn about couples' top concerns, how apps help, and who says they're doing the planning.
The most challenging aspects of wedding planning have remained the same:
Determining budget / guest size
Making decisions
Keeping track of expenses
With wedding planning apps, it's now easy to plan on the go. Couples are spending more hours planning and taking time to visit more venues in person.


Average number of hours spent planning per week
Percent viewed 3+ venues in person
It takes a village! Typically one person assumes the heavy lifting, but with wedding planning, everyone gets in on the fun!
say the bride did all the planning
say the groom did at least some planning
say the parents did at least some planning
Couples acknowledge that online information makes it easier to develop a short-list of vendors to hire.
Finding the perfect wedding vendors is easier thanks to technology, allowing couples to find and book vendors more simply.
Percent researched at least 1 vendor online
Average number of vendors researched online
Said seeing venues/vendors online made it easier to develop a short list of places to see
Average number of vendors hired

More than
doubled!
When it comes to vendor communications, texting has increased but the telephone is still the number one method of communication.
Call their vendor
Email with vendor
Text with vendor
Not only do vendors help alleviate the pressure of wedding planning, but they also remain friends with the couples they work with!
Really enjoyed working with their wedding vendors
Became friends with their wedding vendors

 10 Years of Wedding Planning


